Description
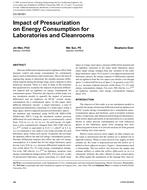
Pressure differential setpoint and air tightness affect both pressure control and energy consumption for containment spaces such as laboratories and cleanrooms. Due to the lack of engineering means to determine the suitable pressure differential setpoint during the design stage, such a setpoint is often intuitively selected. There is a lack of study in the literature that quantitatively examines the impacts of pressure differential setpoint and air tightness on energy consumption for containment spaces. Therefore, the objective of this study is to use simulation models to quantify the impact of pressure differential and air tightness on HVAC system energy consumption for a containment space. In this paper, three different laboratory layouts—a single laboratory, a suite of pressurized laboratories consisting of a small space within a large space, and two adjacent pressurized laboratory spaces— are modeled and simulated using MATLAB SIMULINK (Mathworks 2007). Using the simulation models, pressure differential for each laboratory space is systematically varied from –0.01 in. w.c. to –0.1 in. w.c. for each layout. Air tightness is also systematically changed from 500–3500 cfm/(in. w.c.)0.65 (which is equivalent to 0.16–1.1 cfm/ft2 at 0.3 in. w.c.) to represent a very-tight to very-loose envelope for each laboratory space within each layout. In general, the envelope air tightness affects fan and coil energy consumption greatly. Pressure differential setpoint also affect fan and coil energy consumption. It is found that for the single laboratory space layout, every 0.01 in. w.c. pressure differential setpoint variation yields about 2%–3% total energy consumption change. For every 500 cfm/(in. w.c.)0.65 air tightness variation, total energy consumption changes about 10%. For Layout 2, a suite of pressurized laboratory spaces consisting of a small inner space in a large outer space, pressure differential setpoint and air tightness variations in the inner small laboratory space cause larger energy changes than any variation in the outer large laboratory space. For Layout 3, two adjacent pressurized laboratory spaces, the energy impacts of differential setpoint and air tightness from the two spaces are similar, even though space 1 is about half the size of space 2. In general, every 0.01 in. w.c. pressure setpoint increase yields about 1%–2% total energy consumption change. For every 500 cfm/(in. w.c.)0.65 air tightness variation, total energy consumption changes about 10%.
Units: Dual
Citation: ASHRAE Transactions, vol. 115, pt. 1, Chicago 2009
Product Details
- Published:
- 2009
- Number of Pages:
- 11
- File Size:
- 1 file , 3.2 MB
- Product Code(s):
- D-CH-09-051


